Here’s an “ingelious” way to understand JC A Level H2 Mathematics Hypothesis Testing.
The objective of performing hypothesis testing is to know if a change occurs due to luck or otherwise.
For example, if you are a long distance runner and usually clock in 42mins timing for your 10km run. If you have purchased a pair of high performance shoes and achieved a timing of 30mins the next day, you can probably conclude immediately that the pair of shoes is indeed fantastic.
However, what is tricky is when you have an improvement in
timing of not 30mins, but 40mins.
Could you now conclude that your shoes is indeed fantastic?
Checking the records of your historical runs, you found out that on some “good” days. you managed to clock 40mins as well.
Now, you probably can’t be certain that the new pair of shoes is indeed useful (no, it isn’t Nike Vaporfly).
The aim of performing a hypothesis testing is to have a quantifiable decision.
You will never be certain, but at least you have a level of confidence attached towards your conclusion.
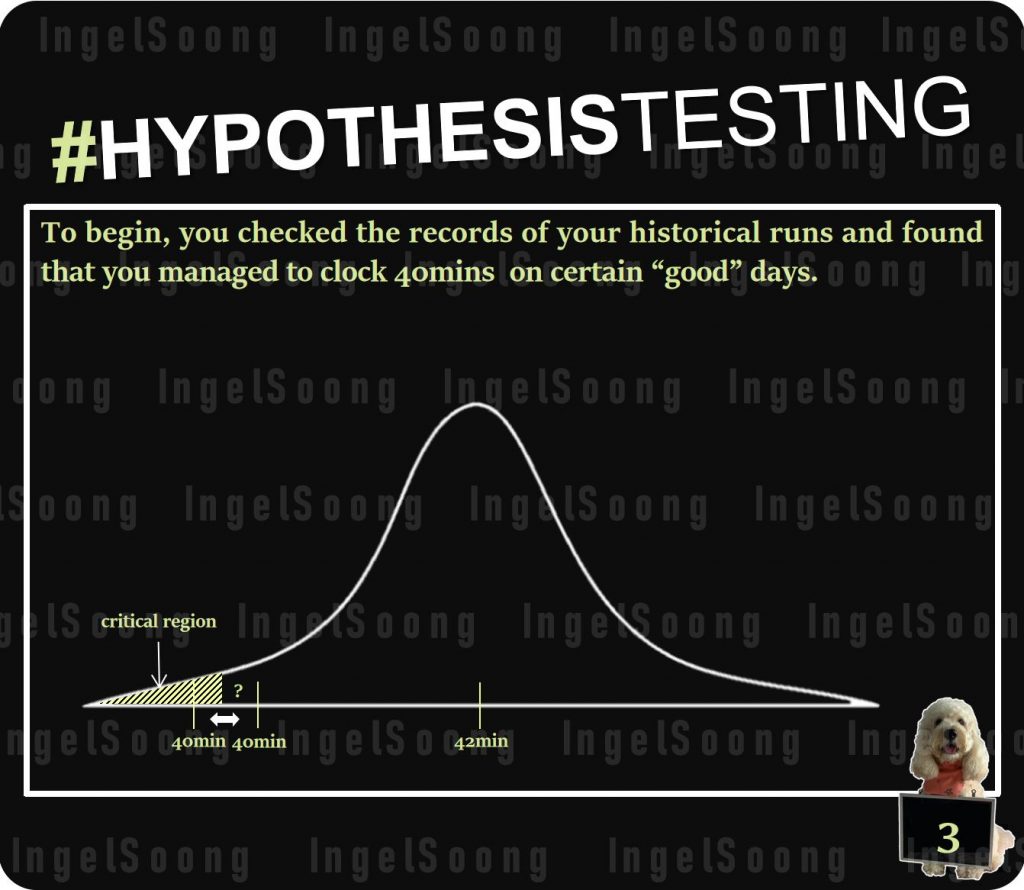
To begin, you checked the records of your historical runs and found that you managed to clock 40mins on certain “good” days.
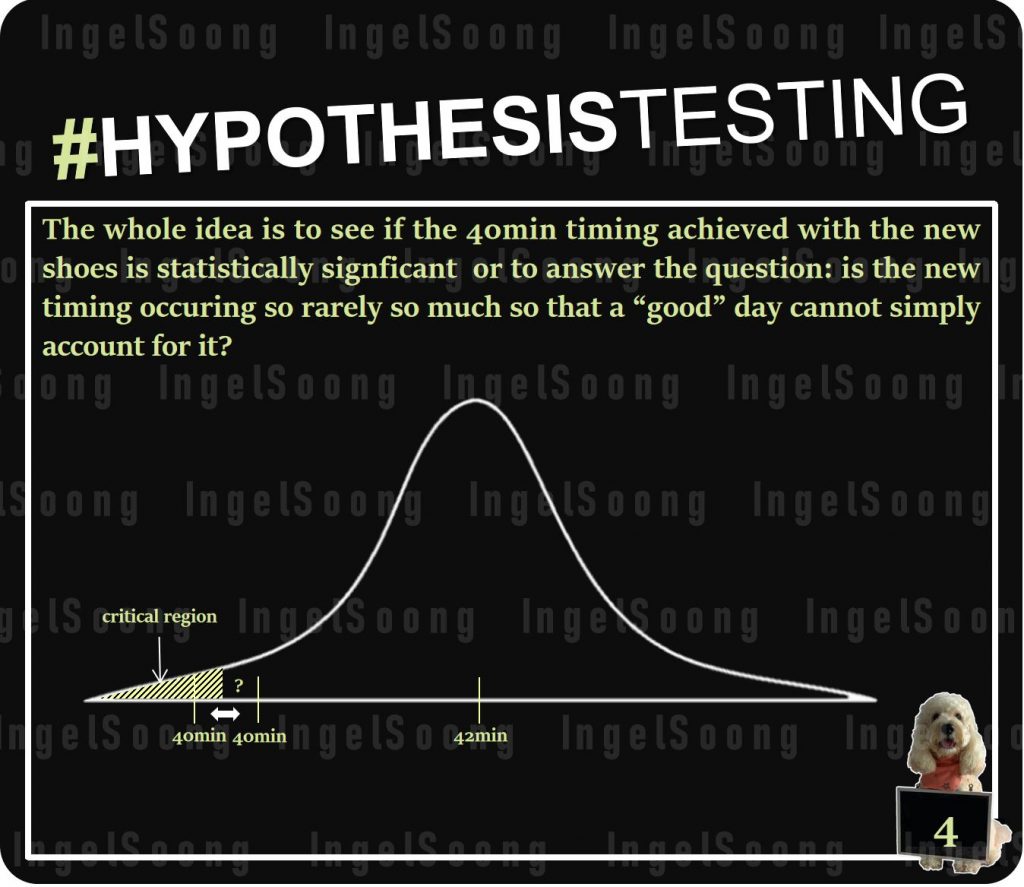
The whole idea is to see if the 40min timing achieved with the new shoes is statistically signficant or to answer the question: is the new timing occuring so rarely so much so that a “good” day cannot simply account for it?
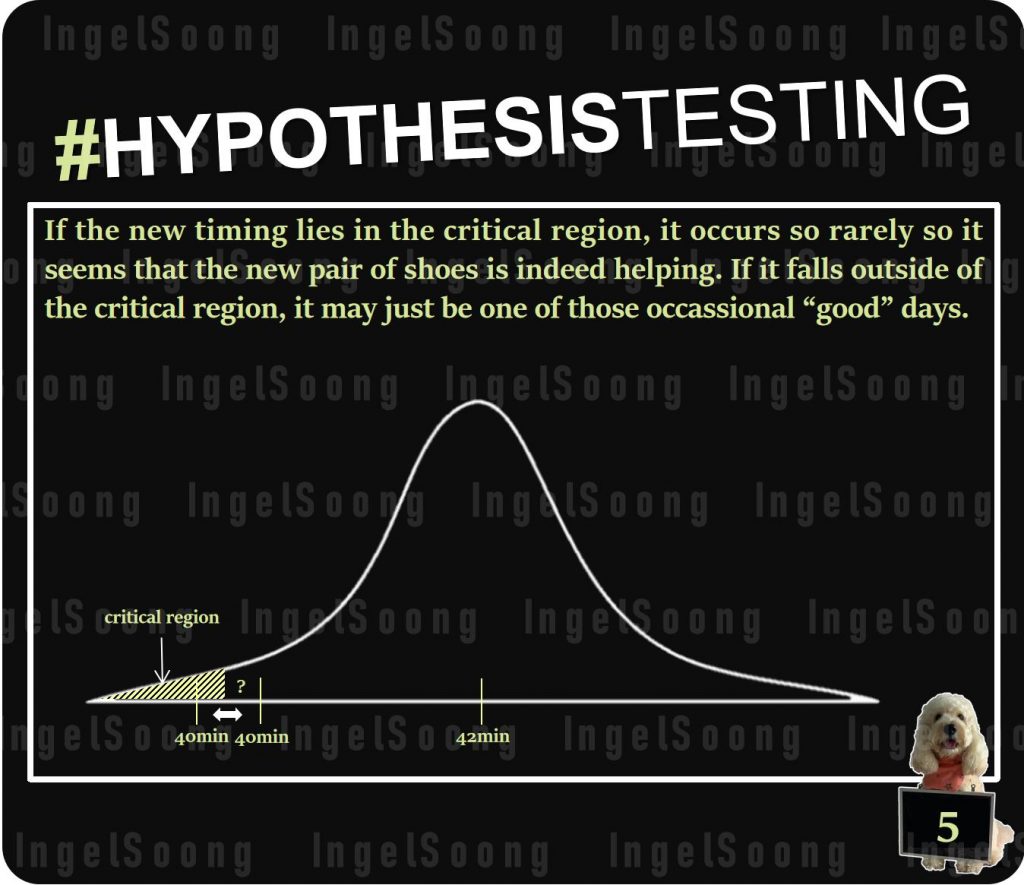
If the new timing lies in the critical region, it occurs so rarely so it seems that the new pair of shoes is indeed helping. If it falls outside of the critical region, it may just be one of those occassional “good” days.
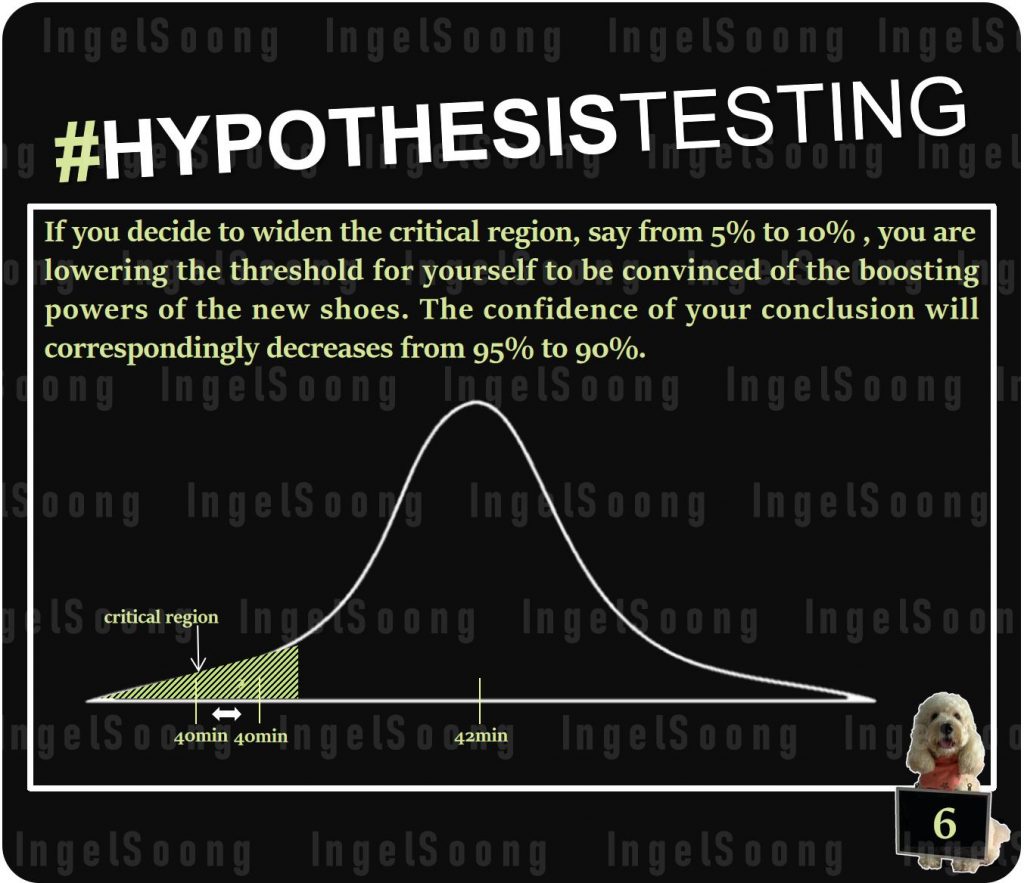
If you decide to widen the critical region, say from 5
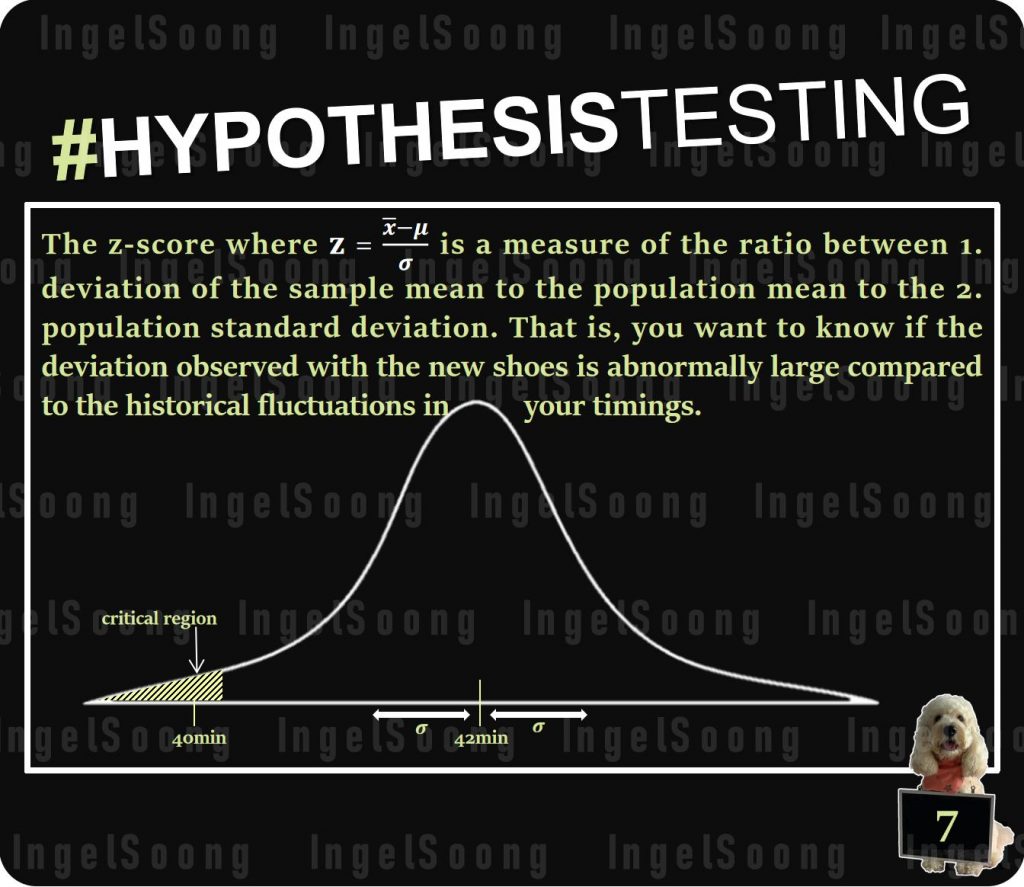
The z-score where z=x̄−μ/σ is a measure of the ratio between 1. deviation of the sample mean to the population mean to the 2. population standard deviation. That is, you want to know if the deviation observed with the new shoes is abnormally large compared to the historical fluctuations in your timings.
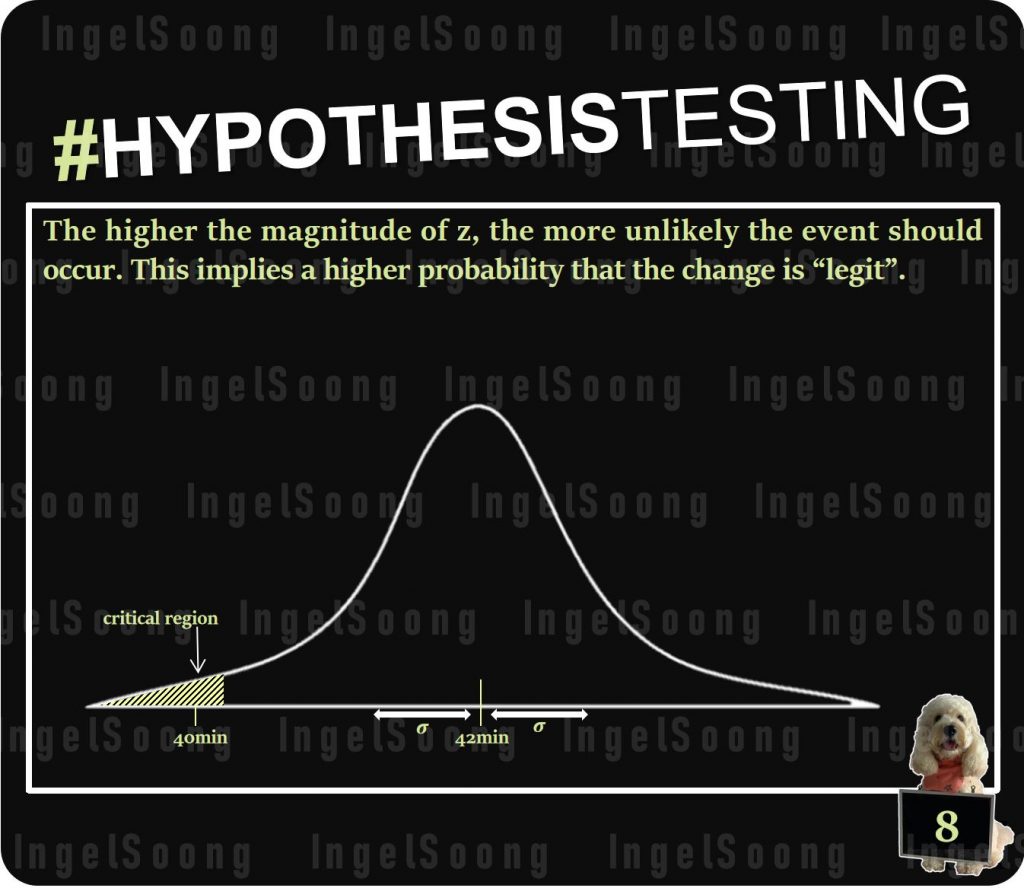
The higher the magnitude of z, the more unlikely the event should occur. This implies a higher probability that the change is “legit”.
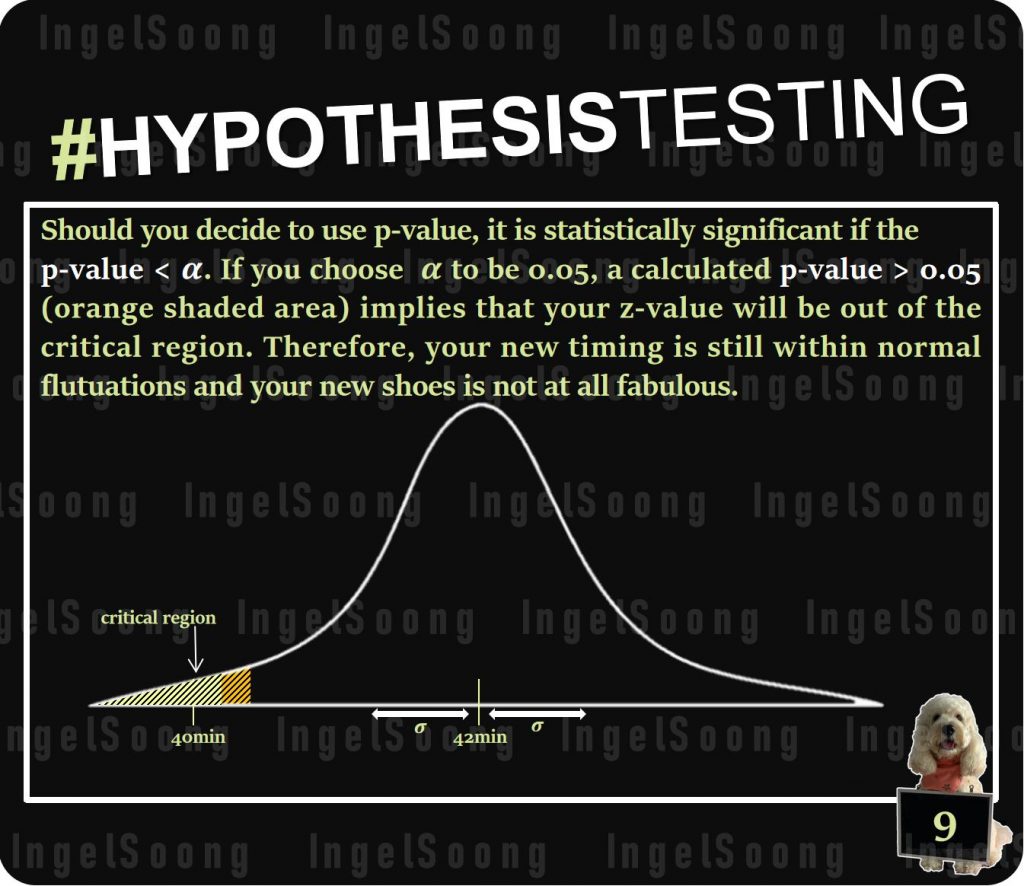
Should you decide to use p-value, it is statistically significant if the
p-value < α. If you choose α to be 0.05, a calculated p-value > 0.05 (orange shaded area) implies that your z-value will be out of the critical region. Therefore, your new timing is still within normal flutuations and your new shoes is not at all fabulous.
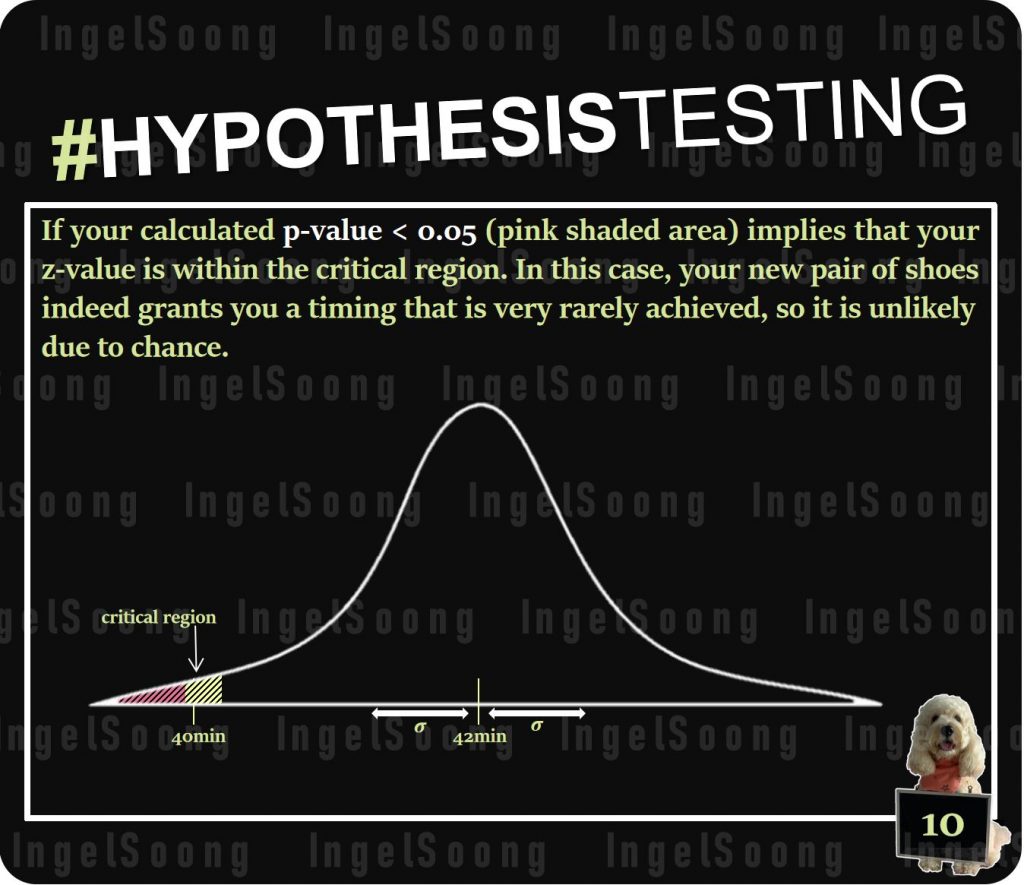
If your calculated p-value < 0.05 (pink shaded area) implies that your z-value is within the critical region. In this case, your new pair of shoes indeed grants you a timing that is very rarely achieved, so it is unlikely due to chance.


